In an era of increasing climate volatility, basing risk assessment on historical data is equivalent to navigating a storm by looking in the rearview mirror. This strategy is no longer merely insufficient—it’s a direct threat to accurate risk pricing and portfolio protection. For decision-makers in commercial insurance, real time data analytics provides the forward-looking guidance necessary to build a proactive, resilient, and profitable strategy.
Why Traditional Risk Models Are Failing in a Volatile Climate
The commercial insurance industry was built on a foundation of historical data. Underwriters, brokers, and risk managers have long relied on decades of loss trends to construct the actuarial tables and predictive models that drive the business. This backward-looking approach was effective when the climate was relatively stable and past events were a reliable predictor of future risk.
That stability is gone.
The frequency and intensity of extreme weather events—from flash floods to catastrophic wildfires—are accelerating at a pace that historical models cannot accommodate. A property’s flood risk, once confidently mapped on a 100-year floodplain, becomes dangerously obsolete when rainfall patterns shift dramatically in a single season. This gap between historical precedent and current reality exposes insurance portfolios to unexpected and severe losses.
A risk model built on yesterday's climate is fundamentally unprepared for tomorrow's weather. Its primary flaw is an inability to process and react to dynamic, unfolding events, leaving insurers vulnerable to sudden spikes in exposure and accumulated risk.
The Problem with a Reactive Stance
Relying on outdated models forces insurance professionals into a perpetually reactive position. By the time a traditional model flags a rising risk, the damage may already be done. This operational lag creates several critical business challenges:
- Inaccurate Pricing: Premiums calculated on historical data will not adequately cover the true, evolving risk, leading to unprofitable underwriting.
- Portfolio Blind Spots: Aggregate risk can accumulate in geographic areas that traditional models still consider "safe"—until a sudden event exposes a massive concentration of exposure.
- Missed Mitigation Opportunities: Without a live view of threats, brokers and risk managers cannot provide clients with the timely advice needed to prevent or reduce losses.
The shortcomings of legacy models are not just a technical issue; they represent a significant business vulnerability. To understand how new technologies are addressing similar data challenges, consider recent advancements in AI for financial analysis.
Transitioning to a proactive strategy using real time data analytics is no longer a luxury—it's an operational necessity. As detailed in our guide on the business impact of climate change, this shift enables insurers to see what is happening *now* and anticipate what is coming next. It transforms risk management from a practice based on historical estimates into a precise, data-driven discipline, enabling smarter, faster decisions that protect both the bottom line and the clients who depend on you.
Understanding How Real Time Analytics Works

Image
To understand real time analytics, consider the difference between a daily newspaper and a live news broadcast.
The newspaper is an example of batch processing. Information is gathered over 24 hours, compiled, and delivered. By the time it is read, the information is already historical. In contrast, a live broadcast uses stream processing. It captures events as they happen, analyzes them instantly, and delivers updates as the situation unfolds.
This immediate, continuous flow of information is the core of real time analytics. It provides a dynamic, living picture of risk that a static, historical report cannot match. This is no longer a "nice-to-have" capability; it's becoming an industry standard. The advanced analytics market, driven by these real time systems, was valued at USD 75.89 billion in 2024 and is projected to reach USD 305.42 billion by 2030.
To clarify the fundamental differences, let's compare the two approaches directly.
Comparing Real Time Analytics to Traditional Batch Processing
This table breaks down the key distinctions and highlights why real time data is a strategic game-changer for modern insurance risk assessment.
| Attribute | Traditional Batch Processing | Real Time Analytics |
|---|---|---|
| Data Timing | Analyzes historical data collected over hours or days. | Analyzes data as it is generated, within seconds or milliseconds. |
| Decision Speed | Supports strategic, long-term planning. | Enables immediate, tactical decisions and operational responses. |
| Risk View | Provides a static, "rear-view mirror" snapshot of past events. | Offers a dynamic, "live feed" of current and emerging risks. |
| Use Case | Quarterly risk reports, annual portfolio analysis. | Live storm tracking, fraud detection, immediate exposure alerts. |
| Business Impact | Reactive. Identifies trends after the fact. | Proactive. Mitigates risk before losses accumulate. |
The transition to real time is not just about speed; it's about shifting from a reactive to a proactive operational posture.
The Three Core Components
A technical background is not required to understand the mechanics of real time analytics. The process involves three key components working in concert to convert raw data into decisive action.
- Continuous Data Ingestion: The system’s ability to pull in massive, continuous streams of information from diverse sources, such as satellite feeds monitoring wildfire perimeters, IoT weather sensors tracking rainfall intensity, or public data on power outages.
- Instant Stream Processing: As this data is ingested, it is processed immediately. Instead of being stored for later analysis, powerful engines filter and structure the information on the fly, preparing it for immediate use.
- Actionable Analytics Engine: This is where raw data becomes business intelligence. The engine applies specific risk models and business rules to the processed data, identifying threats, flagging exposed assets, and triggering alerts for underwriters and risk managers.
This workflow transforms risk management from a periodic review into a constant, vigilant process.
From Data Stream to Decisive Action
Consider a scenario where a severe storm system is developing.
A real time platform continuously ingests Doppler radar data, IoT river gauge readings, and local topographical information. As the storm intensifies, the processing engine calculates its probable path and pinpoints the commercial properties located in the projected flood zone.
The analytics engine then cross-references this with policyholder data, instantly calculating the portfolio's aggregate exposure in that specific area. This entire sequence occurs not in days or hours, but in *minutes or seconds*.
Real time data analytics closes the gap between an event's occurrence and an organization's ability to respond. It provides the critical context needed to move from awareness to proactive, risk-mitigating action before losses accumulate.
This immediate insight empowers underwriters to pause binding new policies in high-alert zones and helps risk managers proactively contact clients with advice that can prevent significant losses.
For those interested in the underlying technology, there is a comprehensive comparison of real-time analytics platforms like Apache Druid and Apache Pinot. The key takeaway for business leaders is that this technology provides a clear operational advantage. Understanding these components is essential for evaluating the various climate risk assessment tools available today.
Practical Applications in Commercial Insurance

Image
The value of real time analytics is demonstrated through its impact on business outcomes. For commercial insurance professionals, this technology enables smarter, more precise actions that protect profitability and enhance client services.
Valued at USD 25 billion in 2023, the real-time analytics market is projected to reach USD 193.71 billion by 2032. This growth is driven by the need to solve the exact challenges insurance leaders face in a volatile climate.
Here is a breakdown of how this technology functions for underwriters, brokers, and portfolio managers.
For Underwriters: Dynamic Pricing and Risk Selection
The primary challenge for underwriters today is pricing risk accurately when climate conditions are constantly changing. Historical data is insufficient for assessing an active wildfire or an imminent flash flood. Real time data fundamentally changes this equation.
Consider an underwriter evaluating a new commercial property submission in a wildfire-prone region. Instead of consulting a static, year-old risk map, they can access a live dashboard displaying:
- Current Wind Patterns: Live feeds on wind speed and direction, which dictate fire spread.
- Vegetation Dryness: Satellite data showing the flammability of the surrounding landscape at that moment.
- Active Fire Perimeters: Instant alerts on the location and movement of any nearby fires.
This live data enables a more informed underwriting decision. The underwriter can use dynamic pricing to adjust the premium to reflect the immediate, observable threat. In extreme cases, they might place a temporary moratorium on binding new policies in that specific zone until the danger passes, shielding the book from a potential catastrophe. This transforms underwriting from a static, backward-looking process into a live, responsive discipline.
For Brokers: Proactive Client Advisory and Retention
Brokers are responsible for advising clients and maintaining strong relationships. Real time analytics empowers them to transition from reactive problem-solvers to indispensable risk advisors by offering proactive guidance that prevents or reduces major losses.
Imagine a broker with multiple commercial clients in a coastal area as a hurricane approaches. A real time system can send automated alerts to the broker the moment a client's property falls within the storm's projected path.
This is not simply another weather update. It is a targeted, actionable insight that pinpoints a specific client's assets at risk, empowering the broker to provide immediate, high-value advice on loss prevention.
The broker can then contact the client with specific guidance, such as recommending they secure the property or move critical inventory to higher ground. This level of proactive service not only helps the client mitigate a potential loss but also demonstrates the broker's value beyond the policy itself. This approach builds client loyalty and retention in a competitive market and aligns with strategies outlined in our disaster preparedness for businesses guide.
For Portfolio Managers: Live Exposure Monitoring
Managing aggregate risk is fundamental to a sound insurance operation. Portfolio managers must constantly assess total exposure to major events. Real time data provides this answer not as a quarterly estimate, but as a live, constantly updating metric.
As a major storm system develops, a risk manager can use a real time platform to model its impact across the entire portfolio. The system overlays the storm’s live track and intensity forecast onto a map of all insured properties, instantly calculating the total insured value (TIV) at risk.
This live view of aggregate exposure informs critical strategic decisions:
- Capital Allocation: Are our capital reserves sufficient to cover potential claims from this single event?
- Reinsurance Strategy: Does this data justify a decision to purchase additional reinsurance to cover this concentrated risk?
- Claims Preparedness: Can we deploy claims teams toward the hardest-hit areas now to ensure a rapid response once the storm passes?
This capability elevates portfolio management from an exercise in historical modeling to a dynamic command-and-control function, providing leaders with the clarity needed to navigate the business through major events.
Turning Instant Insights into Business Value
Implementing real time data analytics is about unlocking strategic business value that directly impacts the bottom line, enhances client loyalty, and creates a sustainable competitive advantage. For insurance leaders, the ability to act on an insight at the moment it emerges is what separates monitoring a risk from preventing a loss. This is how risk management evolves from a cost center into a value-generating function.
Realizing this value requires a culture centered on data-driven decision-making. This involves creating an environment where immediate, data-backed actions are standard operating procedure. It is a strategic shift that empowers teams to convert information into a competitive advantage.
The market is responding to this need. The global real-time analytics market was valued at approximately USD 890.2 million in 2024 and is projected to reach USD 5,258.7 million by 2032. This growth is fueled by the critical demand for immediate, actionable insights.
Protecting Underwriting Margins
The most direct financial benefit of real time analytics is its ability to protect underwriting margins through enhanced risk selection and pricing accuracy. Static models are ill-suited for pricing assets exposed to dynamic threats like wildfires or floods, often resulting in unprofitable policies.
With a live view of evolving conditions, underwriters can make smarter, more profitable decisions. For instance, they can implement dynamic pricing that adjusts premiums based on real-time threat levels or place a moratorium on binding new policies in an area where a wildfire is actively spreading. This precision prevents adverse selection and ensures premiums accurately reflect immediate risk, which directly reduces loss ratios.
Real time analytics transforms pricing from a static calculation into a dynamic defense mechanism. It equips underwriters to protect the portfolio's profitability by aligning premiums with the ground-truth reality of risk, moment by moment.
Optimizing Capital Allocation
A clear, continuous view of portfolio-wide risk exposure enables more effective capital allocation and strategic planning. Historically, calculating aggregate exposure during a hurricane was a slow process based on outdated models.
Now, risk managers can track a storm's live path and instantly see the total insured value (TIV) of every asset in its way. This immediate clarity allows leadership to make critical financial decisions with confidence:
- Assess Capital Adequacy: Determine in minutes if current capital reserves are sufficient to cover potential claims from an unfolding event.
- Inform Reinsurance Strategy: Use live exposure data to justify last-minute reinsurance purchases to offload concentrated risk.
- Streamline Resource Deployment: Proactively position claims adjusters and recovery teams near anticipated impact zones for a faster response.
This capability ensures that capital is deployed efficiently, protecting the firm’s financial stability during periods of peak volatility.
Enhancing the Client Experience
Beyond financial metrics, real time analytics can redefine the client relationship, shifting it from a simple transaction to a proactive partnership. By monitoring emerging threats, brokers and risk managers can provide clients with timely, specific advice on how to mitigate risk *before* a loss occurs.
This proactive service builds significant trust and loyalty. When a major event does occur, the same real time insights lead to faster claims processing. By identifying impacted properties immediately, insurers can initiate the claims process without delay, delivering critical support to clients when they are most vulnerable. This superior service becomes a powerful differentiator, strengthening client retention and building a solid market reputation.
A Strategic Framework for Implementation
Adopting real time data analytics is a strategic business decision, not merely an IT project. A clear, disciplined implementation plan that ties technology directly to business outcomes is essential for success.
This phased framework, illustrated with a hypothetical platform called 'Sentinel Shield,' simplifies the process and focuses on value creation. This is not about installing software; it is about a core business transformation aimed at delivering actionable insights.
Define Core Business Objectives
The first step is to answer the question: *What specific business problem are we trying to solve?*
Vague goals like "improve risk assessment" are insufficient. Objectives must be specific, measurable, and tied to a key performance indicator (KPI). This ensures the project is aligned with tangible business value.
A strong objective would be: "Reduce wildfire-related claims losses in our California commercial property portfolio by 15% within 24 months." This target immediately clarifies which data sources are critical and how the system must be configured to deliver relevant alerts.
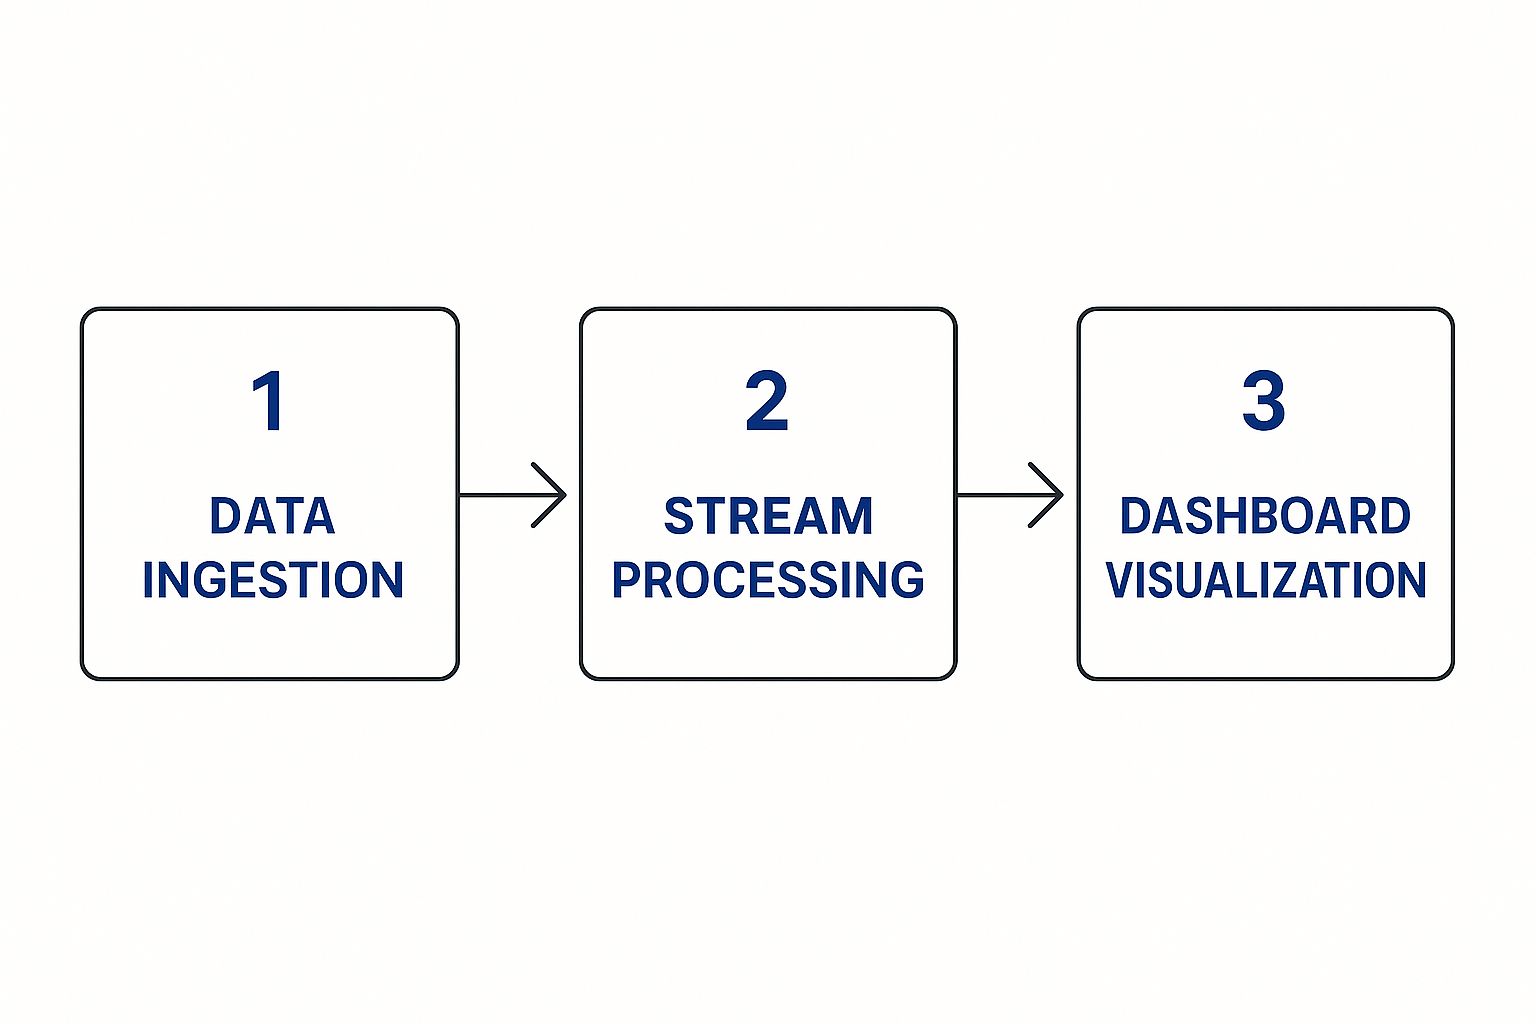
The implementation of real time data analytics is a continuous loop—from data ingestion to smarter, faster decisions.
Image
This flow illustrates the critical path: ingesting relevant data, processing it in real time, and delivering it through clear, actionable dashboards that drive decisions.
Integrate the Right Data Sources
With a clear objective defined, the next step is to connect the data streams that will fuel the insights. This is not about data hoarding; it is about the surgical integration of the *right* data.
For our wildfire objective, Sentinel Shield would need to connect to key sources:
- Satellite Imagery: For active fire perimeters and real-time vegetation dryness.
- Weather Feeds: For live wind speed and direction, critical factors in fire spread.
- Internal Property Data: The policy administration system contains the locations and details of every insured asset.
Integrating these feeds creates a single, unified view of the risk landscape as it changes. This integrated data foundation is the bedrock for generating accurate and timely alerts.
Configure Custom Risk Models
Once data is flowing, the system must be configured to identify what matters. This involves translating underwriting appetite and business rules into custom risk models and alert thresholds. In essence, you are encoding your team's expertise into the Sentinel Shield platform to operate at machine speed.
Implementation is not about installing software; it is about encoding your business logic and risk tolerance into a system that can execute it tirelessly. This is how you convert raw data into proprietary risk intelligence.
For the wildfire scenario, specific rules would be configured:
- Alert Trigger: Flag any insured property within 10 miles of an active, uncontained wildfire.
- Binding Moratorium: Automatically place a temporary hold on binding new policies in ZIP codes where winds exceed 30 mph toward an active fire.
These custom rules separate signal from noise, ensuring that alerts are relevant and immediately actionable. Many insurers evaluate different types of software for insurance companies to find a platform that offers this crucial level of control.
Deploy User-Centric Dashboards
The final step is delivering insights to the decision-makers. A successful implementation culminates in simple, intuitive dashboards designed for specific roles—whether an underwriter, a risk manager, or a claims adjuster.
These dashboards consolidate information, visualizing portfolio risk, tracking emerging threats, and providing the context needed to make a quick, confident decision.
This structured approach transforms a complex project into a series of manageable, value-focused steps, ensuring that your investment in real time data analytics translates directly into a more resilient and profitable business.
Building a Future-Proof Risk Management Strategy

Image
In a world defined by climate volatility, adaptability is the core of a sustainable business. Traditional risk management, built on the stable patterns of the past, is unequipped for the dynamic threats of today. Integrating real time data analytics is the definitive step toward building a resilient, future-proof insurance operation.
This technology shifts risk management from a periodic, reactive exercise into a continuous, proactive discipline. It delivers the superior risk intelligence needed to not only survive but thrive in an uncertain market. The ability to see and act on threats as they emerge creates a sustainable competitive advantage.
Creating Lasting Competitive Advantage
The true power of real time data analytics lies in its ability to drive a fundamental business shift. It helps build more profitable portfolios by sharpening risk selection, preventing adverse selection, and aligning premiums precisely with on-the-ground reality.
This capability builds resilience at every level of the organization:
- Underwriting Precision: Protects margins by avoiding mispriced risks in rapidly changing environments.
- Portfolio Stability: Offers a clear, live view of aggregate exposure to prevent a catastrophic accumulation of risk.
- Client Retention: Strengthens client relationships through proactive, value-added risk mitigation advice.
Adopting real time data analytics is not a simple technology upgrade; it is a strategic business imperative. It is the mechanism that transforms risk from an unpredictable threat into a manageable, measurable component of your growth strategy.
The Path to Market Leadership
For insurance leaders, the call to action is clear. The time has come to embrace this capability as a cornerstone of operational strategy, not just a niche tool. This shift is essential for securing market leadership and navigating the complex climate risk landscape of tomorrow.
By embedding these systems into core workflows, you are not just purchasing software; you are investing in a new operating model. This concept aligns with a broader strategy of business intelligence for insurance providers. The ultimate goal is to build an organization that is as agile and responsive as the data it consumes, ensuring long-term profitability and relevance.
Answering Your Top Questions
Transitioning to a proactive risk strategy raises key questions for underwriters, brokers, and risk managers. Here are direct answers to common concerns about implementing real time analytics.
How does this integrate with our legacy systems?
This is a critical operational question. Modern real time analytics platforms are designed for seamless integration, not rip-and-replace projects. They act as an intelligent layer that connects to your existing policy administration or claims management systems via APIs.
This architecture allows the platform to pull necessary policy and property data from your core systems and merge it with live external data from satellites, weather feeds, and IoT sensors. The intensive processing and analysis occur within the analytics platform, which then delivers clean, actionable alerts to your team through a simple dashboard or directly into the software they already use. The goal is to augment capabilities, not disrupt existing workflows.
How can we ensure the data is accurate and trustworthy?
Data integrity is paramount when making high-stakes underwriting decisions. A robust real time data analytics platform addresses this challenge through several mechanisms.
- Data Validation: The system incorporates automated checks to filter out anomalies, errors, and incomplete information before it reaches the user.
- Source Vetting: Data providers are carefully selected. We partner exclusively with authoritative sources for climate and peril data, such as government agencies like NOAA and specialized meteorological services.
- Data Enrichment: The platform cross-references and combines data from multiple streams to create a more accurate and comprehensive view. For example, it can layer a property address from your system with high-resolution topographical data to produce a more precise flood risk assessment.
How do we measure the ROI on this investment?
The return on investment from a real time analytics platform is tangible and can be tracked using existing business metrics. It is crucial to establish a baseline for key indicators before implementation to measure improvement over time.
ROI is measured in prevented losses, protected underwriting margins, and stronger client relationships. It is the bottom-line result of making smarter, faster decisions when it counts.
Key metrics to monitor include:
- Reduced Loss Ratios: By anticipating active perils and flagging high-risk submissions, you can directly measure the reduction in claims payouts for specific events like wildfires, hail, or floods.
- Improved Underwriting Profitability: Compare the performance of policies priced using dynamic, real time data against those priced with static models. The difference in profitability demonstrates clear value.
- Increased Client Retention: Track retention rates for clients who receive proactive risk alerts and mitigation advice. This metric shows the platform's value in transforming your role from a policy provider to a true risk partner.
---
Ready to shift your risk management from reactive to proactive? See how Insurtech.bpcorp.eu delivers the real-time climate intelligence needed to find high-intent commercial opportunities right when your help is needed most. Learn more about Sentinel Shield and start turning climate risk into measurable growth. Find out more at Insurtech.bpcorp.eu.