Business intelligence for insurance is the process of collecting, analyzing, and visualizing data to make smarter, faster, and more profitable decisions. It moves beyond basic reporting, creating a clear, data-driven vantage point over your entire landscape of risk, operations, and market opportunities. It is how you transform raw information into a competitive advantage for underwriters, brokers, and risk managers.
The New Strategic Compass for Insurers

Image
In an industry built on pricing risk, the new frontier is not just reacting to data—it's using data to anticipate future events. For decision-makers in commercial insurance, business intelligence (BI) is no longer a technology tool; it is the strategic compass for the business. It delivers the clarity needed to navigate an increasingly complex and volatile market.
BI consolidates disconnected data points from policies, claims, climate models, and market trends into a unified roadmap for growth. This enables leaders to proactively shape risk portfolios, tailor client solutions, and optimize internal operations with precision. The principle is simple but powerful: make every decision based on evidence, not intuition.
From Historical Reporting to Predictive Foresight
The critical shift driven by business intelligence is from rearview-mirror reporting to predictive foresight. Traditional reports show what happened last quarter. A robust BI platform forecasts what is likely to happen next. This transition is essential for both survival and market leadership.
For insurance leaders seeking to sharpen their strategic edge, mastering data-driven insights is non-negotiable, a topic also explored in resources like this financial services business intelligence: a guide for bank executives.
This foresight provides your organization with the ability to:
- Anticipate Market Changes: Pinpoint emerging risks—such as new climate-related threats or sudden shifts in commercial property vulnerabilities—before they impact your bottom line.
- Improve Underwriting Accuracy: Price risk with greater confidence by analyzing granular data on historical losses, property characteristics, and real-time environmental factors.
- Enhance Client Relationships: For brokers, data-driven insights validate their advisory role, helping pinpoint specific client needs and recommend proactive risk mitigation strategies that deliver tangible value.
Business intelligence is the engine that connects data directly to business outcomes. It answers not just "what happened?" but "why did it happen?" and, most importantly, "what should we do next?" This capability separates market leaders from the rest.
Ultimately, integrating business intelligence for insurance is about building a more resilient and profitable organization. It empowers underwriters, brokers, and risk managers to make informed, strategic choices that drive sustainable growth.
To see more examples of how technology is reshaping the industry, explore further insights on our Insurtech blog.
How Business Intelligence Works in Insurance
How does business intelligence function within the insurance sector? Let's demystify the process.
Think of a BI platform as the definitive command center for an underwriter, claims manager, or broker. It integrates critical data streams—market trends, historical policy performance, live claims data, and climate risk models—into a single, coherent view. This enables insurance professionals to move from assumption to sharp, informed decision-making.
At its core, BI executes three functions: it aggregates all your raw data, runs analytics to identify meaningful patterns, and presents those findings in an actionable format. It is the process of converting disconnected policy numbers, claim reports, and market statistics into strategic intelligence.
The Three Pillars of Insurance BI
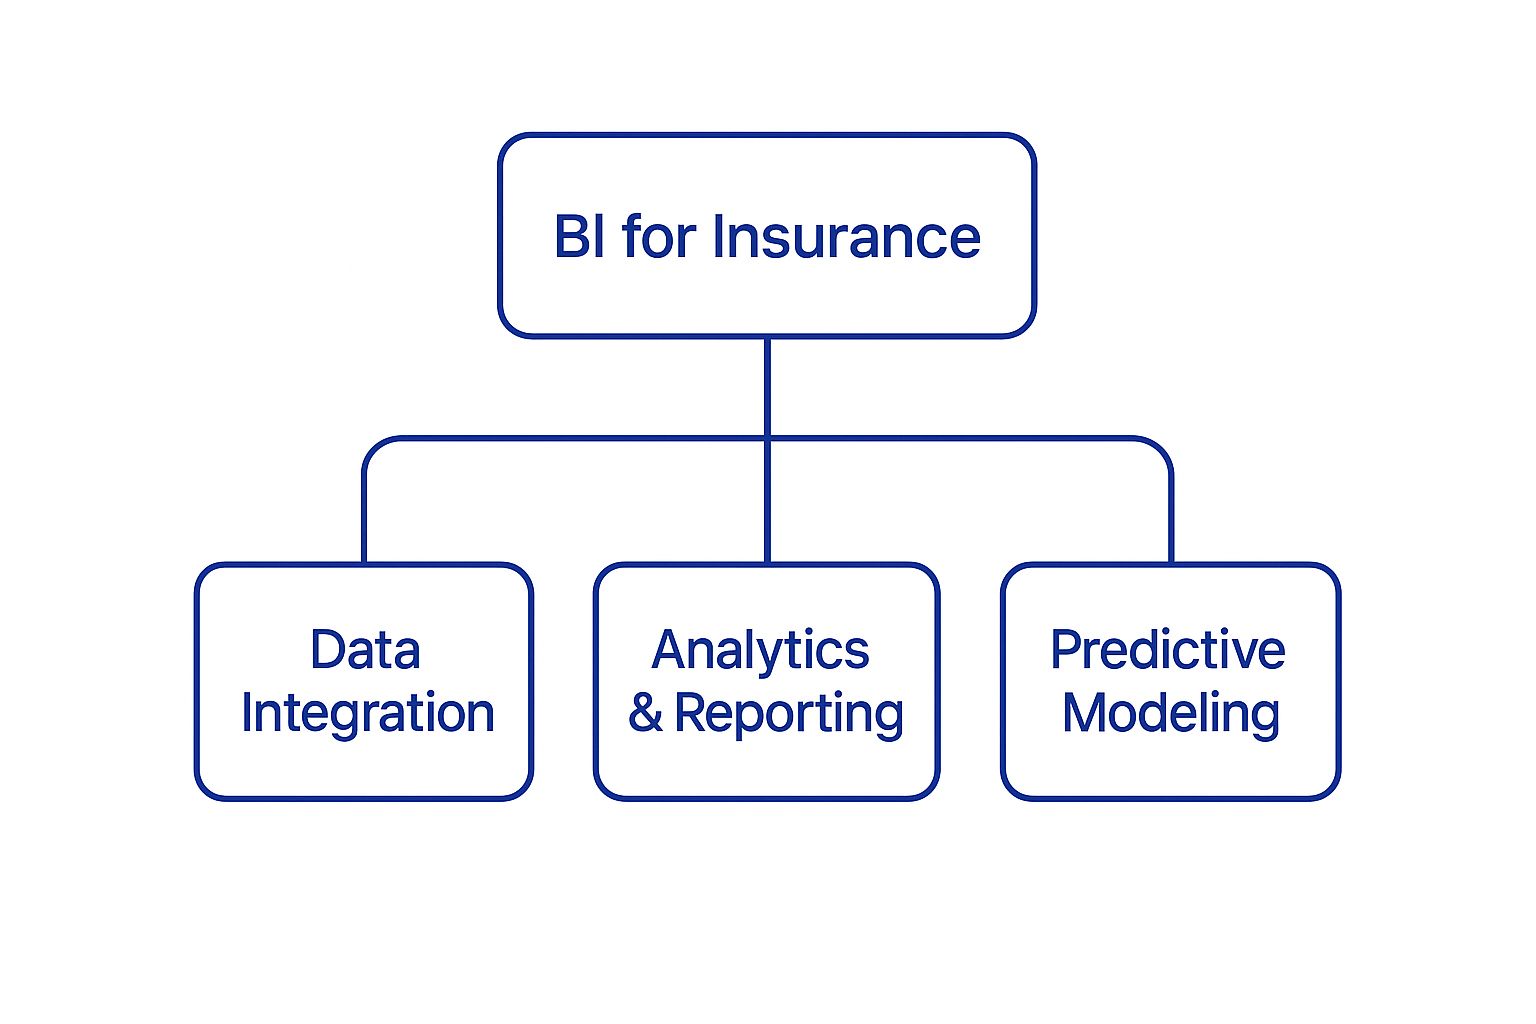
The power of a robust business intelligence system is built on three core pillars. Each performs a specific function in converting raw information into strategic insight, providing insurance professionals a distinct competitive advantage. They work in concert to deliver a complete picture of risk, performance, and opportunity.
This diagram illustrates how Data Integration, Analytics & Reporting, and Predictive Modeling form the foundation of a modern BI platform for insurance.
Image
A sound BI strategy begins with data consolidation, followed by analysis, and culminates in using that analysis to predict future outcomes. Let's break down each stage.
From Raw Data to Actionable Insight
The journey from a siloed spreadsheet of policy numbers to a precise underwriting decision follows a clear path. It begins by collecting and standardizing data from across the business and external sources.
- Data Aggregation and Integration: First, BI tools connect to disparate, often siloed, data sources. This includes your policy administration system, claims management database, CRM, and external sources like weather data, property records, or climate models. The objective is to create a single source of truth so all stakeholders operate from the same reliable information.
- Analytics and Reporting: Once data is centralized, the system runs analytics to answer key business questions. This is where you move from knowing *what* happened to understanding *why*. Instead of merely seeing that claims are up, you can pinpoint the specific policy types, regions, or risk factors driving the increase.
- Visualization and Dashboards: Finally, these insights are presented in visual formats such as charts, graphs, and interactive maps. A well-designed dashboard allows an underwriter to view their entire book of business at a glance, identify outlier risks, and drill down into a specific policy with just a few clicks.
This methodical approach is what makes business intelligence for insurance so effective. It delivers the clarity required to navigate underwriting complexity and manage claims with precision.
The real value of BI is not just in the data it collects, but in the questions it enables you to ask. It empowers professionals to explore trends, test hypotheses, and uncover hidden opportunities—without requiring a Ph.D. in data science.
This is especially critical for risk management. Combining BI with advanced analytics is fundamentally changing how insurers identify fraud, manage portfolio-level risks, and personalize the client experience. Traditional methods are too slow to address challenges like insurance fraud, which costs the industry an estimated $308.6 billion annually worldwide.
Ultimately, this structured process leads to better, faster, and more profitable decisions. For sales and brokerage teams, recognizing these patterns is also a game-changer. To learn more, read our guide on using predictive analytics in sales to target high-value opportunities.
Driving Profitability for Underwriters and Brokers

Image
For business intelligence to be effective, it must directly impact the bottom line. For underwriters and brokers, this means converting data into revenue, operational efficiency, and stronger client relationships. BI provides the analytical power they need to move from estimation to sharp, strategic decision-making.
Instead of relying on historical averages and intuition, professionals can now access granular insights that expose hidden risks and uncover new opportunities. This represents a fundamental shift from reacting to market changes to proactively shaping them. The right business intelligence for insurance platform acts as a high-powered lens, bringing the details that matter into sharp focus.
Empowering Underwriters with Precision Risk Pricing
Underwriters are the financial gatekeepers of the insurance industry. Their success depends on the accuracy of their risk assessments. Business intelligence elevates this process from an art to a data-driven science, leading directly to more precise and profitable pricing.
This is particularly true when managing complex risks like catastrophic weather events. By integrating real-time climate data with historical claims and property information, underwriters can model potential losses with an accuracy previously unattainable. We cover the technology behind this in our overview of modern climate risk assessment tools.
With a robust BI system, underwriters gain several key advantages:
- Granular Portfolio Analysis: A portfolio is no longer a single block of risk. Underwriters can segment it by dozens of variables—location, property type, construction materials, or claim frequency. This helps identify pockets of profitability and, more importantly, concentrations of risk that demand immediate attention.
- Dynamic Pricing Models: BI enables underwriters to build dynamic models that adjust in real-time as new data becomes available, ensuring premiums accurately reflect the current risk landscape.
- Identification of Profitable Niches: By analyzing market-wide data, underwriters can spot underserved or mispriced segments, allowing them to pursue new business where competitors still rely on outdated risk assumptions.
Unlocking Growth for Brokers with Data-Driven Advisory
For brokers, the role is evolving from transactional facilitator to trusted risk advisor. Business intelligence is the engine driving this transformation, providing the hard data needed to substantiate recommendations and demonstrate value to clients.
A broker equipped with BI can anticipate a client's needs before the client recognizes them. By analyzing a client's claims history against industry-wide and climate-related trends, they can flag emerging vulnerabilities and propose specific coverage or risk mitigation strategies. This proactive stance builds significant client loyalty.
Business intelligence transforms the broker-client conversation. It moves from "Here is your renewal quote" to "Based on an analysis of emerging weather patterns and your specific operational risks, here is a strategy to protect your business."
This data-first approach also creates direct paths to growth. By understanding a client’s complete risk profile, brokers can identify cross-selling and upselling opportunities more effectively. For instance, BI might reveal that a commercial property client in a flood-prone area lacks business interruption coverage—a clear and immediate opportunity.
To effectively manage profitability, insurers must track metrics like their customer acquisition cost calculation. BI dashboards place crucial KPIs like submission-to-bind ratios and client retention rates front and center, helping brokers and agencies optimize their sales funnel. Ultimately, it gives every professional the tools to contribute directly to the firm's financial health.
Practical Applications of Insurance BI
<iframe width="100%" style="aspect-ratio: 16 / 9;" src="https://www.youtube.com/embed/QFyM3w95fXI" frameborder="0" allow="autoplay; encrypted-media" allowfullscreen></iframe>
The true power of business intelligence for insurance is realized when it is applied to solve specific, high-stakes problems across the industry—from the underwriting desk to the claims department.
These applications are not abstract concepts; they are tangible solutions being deployed now to reshape daily operations and strategic decisions. They demonstrate how integrated data and smart analytics provide a decisive edge in managing risk, detecting fraud, and retaining valuable clients. Let's examine three scenarios where BI is making a measurable impact.
Dynamic Underwriting for Commercial Property
A national carrier specializing in commercial property faced the challenge of accurately pricing policies in regions increasingly exposed to climate-related risks like flash floods and wildfires. Their legacy models, reliant on historical loss data, were becoming obsolete against rapidly changing weather patterns, leading to underpriced risk and significant portfolio losses.
The solution was a BI platform that integrated multiple dynamic data sources. This system combined real-time climate risk data, information from IoT sensors on insured properties (e.g., water leak detectors), and the carrier’s own detailed claims history.
The result was a dynamic risk-scoring model.
Underwriters could now view a property's risk profile on an interactive dashboard that updated continuously. For example, they could assess not only a building's location in a floodplain but also current soil moisture levels and local weather forecasts in real time.
This enabled them to:
- Price policies with far greater precision, tying premiums directly to current exposure.
- Offer risk-based discounts for clients who installed mitigation measures, such as storm shutters or fire-resistant roofing, which the BI system tracked.
- Proactively manage portfolio concentration by flagging areas where total risk accumulation was too high.
The impact was immediate. The carrier reduced its loss ratio in high-risk zones by 12% within the first year and improved its submission-to-bind ratio by offering more competitive, data-backed quotes.
Proactive Claims Fraud Detection
Fraudulent claims are a persistent threat to insurers. A regional insurer was burdened by a reactive, manual review process that caught only a fraction of suspicious claims, often after payments had been disbursed.
To address this, they implemented a business intelligence for insurance solution with a predictive analytics engine. The system analyzed incoming claims data against historical fraud patterns and third-party data to flag suspicious activity in real time. It used link analysis to uncover hidden relationships between claimants, repair shops, and medical providers, revealing collusive fraud networks that were previously invisible.
A claim flagged by the system would display a "risk score" based on dozens of variables, such as a claimant's history of frequent, small claims or the involvement of a body shop previously tied to fraudulent repairs.
This allowed the special investigations unit (SIU) to focus its resources on high-probability cases *before* payments were made. The BI dashboard visualized these networks, enabling investigators to connect disparate information and build stronger cases.
The result was a $15 million reduction in fraudulent payouts in the first 18 months and a 30% increase in the SIU's efficiency. To maximize BI's effectiveness, data presentation is critical. Exploring essential data visualization best practices demonstrates how powerful visuals can transform complex fraud data into clear, actionable intelligence.
Enhanced Broker Client Retention
A large commercial insurance brokerage recognized that client retention was fundamental to its growth. However, they lacked a systematic method for identifying clients at risk of attrition or for providing proactive, value-added risk management advice.
They implemented a BI platform that integrated their CRM system with policy data and external market intelligence. This created a 360-degree view of each client, tracking communication frequency, claims history, and even changes in their industry's risk landscape.
The system used this data to generate a "retention risk score" for every client. A client with a recent unresolved claim and declining communication, for example, would be flagged for immediate attention.
This armed the brokerage to:
- Predict Churn: Proactively engage at-risk clients with targeted outreach and support before attrition occurred.
- Personalize Advice: The BI dashboard highlighted new risks relevant to a client's specific industry, helping brokers provide timely, data-driven advice.
- Identify Opportunities: The system flagged coverage gaps, creating data-backed opportunities for cross-selling.
By shifting from a reactive to a proactive client management model, the brokerage increased its client retention rate by 8% and grew cross-sell revenue by 15%.
These examples show how BI tools are being applied across the insurance value chain, from product development to claims settlement. Each function finds a unique way to turn data into a competitive advantage.
Business Intelligence Applications Across the Insurance Value Chain
The table below outlines how different departments within an insurance company can leverage business intelligence to drive better outcomes.
| Insurance Function | BI Application Example | Primary Benefit |
|---|---|---|
| Product Development | Analyzing market trends and competitor pricing data to design more competitive and profitable insurance products. | Faster time-to-market and increased market share. |
| Underwriting & Pricing | Using predictive models with real-time data to assess risk more accurately and set dynamic, precise premiums. | Improved loss ratios and pricing accuracy. |
| Marketing & Sales | Segmenting customers based on behavior and risk profiles to create targeted campaigns and identify cross-sell opportunities. | Higher customer acquisition and retention rates. |
| Claims Management | Applying predictive analytics to flag potentially fraudulent claims in real time for immediate investigation. | Reduced fraudulent payouts and lower operational costs. |
| Customer Service | Creating a 360-degree customer view to personalize interactions and proactively address potential issues. | Enhanced customer satisfaction and loyalty. |
As demonstrated, the applications are broad and impactful. BI is not merely an IT project; it is a core business strategy that delivers tangible value at every stage.
Building a Winning BI Strategy

Image
Implementing a business intelligence platform is a strategic business initiative, not just an IT project. A successful BI strategy is built on three pillars: clearly defined goals, high-quality data, and user adoption. Without this framework, even the most advanced technology will fail to deliver meaningful results.
The most critical first step is to start with the business problem, not the technology. Ask: What is the most pressing challenge we need to solve? This question should anchor the entire initiative. Are you trying to reduce claims leakage in commercial property? Improve underwriting profitability in high-risk zones? Or boost client retention rates?
By defining a specific objective, you can then identify the key performance indicators (KPIs) that measure success. This focused approach ensures your business intelligence for insurance initiative is tied directly to measurable financial and operational outcomes from day one.
Establishing a Data-Driven Foundation
Once your business goals are set, the focus must shift to the data itself. Effective BI is impossible without reliable, accessible, and well-governed data. This is where data governance is non-negotiable.
Data governance is the framework of rules, roles, and processes that ensures your data is accurate, consistent, and secure. It answers critical questions:
- Who owns the data?
- Who has access to it?
- How is data quality maintained?
Without strong governance, you risk making critical business decisions based on flawed information. A successful BI implementation depends on creating a "single source of truth" that everyone in the organization trusts.
A common mistake is investing in a sophisticated BI tool without first addressing underlying data quality. This is like building a skyscraper on a weak foundation—it is destined to fail. Prioritize data quality and governance before selecting software.
Selecting Tools and Fostering Culture
With clear goals and a solid data foundation, you can begin evaluating BI tools. The market offers numerous options, but the best choice is the one that aligns with your specific needs. Look for platforms with intuitive dashboards, self-service analytics, and features designed for the insurance industry. For more detailed guidance, our article on the right software for insurance companies can help you navigate the options.
However, the best tool is useless if no one uses it. This brings us to the final, and most critical, component: fostering a data-driven culture. This requires more than just providing dashboards; it means training underwriters, brokers, and managers to ask intelligent questions of the data.
To avoid common pitfalls, your implementation plan must include:
- Executive Sponsorship: Secure buy-in from senior leadership, who must champion the initiative and communicate its strategic importance.
- User-Centric Training: Provide hands-on training that demonstrates how BI solves users' specific, day-to-day challenges. Make it relevant to their roles.
- Start Small and Iterate: Do not attempt a large-scale, enterprise-wide rollout at once. Launch a pilot project focused on one clear business goal, demonstrate its value, and then expand from there.
This phased approach ensures your BI strategy delivers a strong return on investment by aligning technology, data, and people toward a common business objective.
What's Next for Business Intelligence in Insurance?
The field of business intelligence for insurance is not static. It is continually being reshaped by new technologies that promise to redefine how risk is assessed and how insurers connect with clients. Decision-makers must look beyond current tools to understand what comes next. Staying ahead of the curve means understanding how emerging technologies will overhaul operations, create new product categories, and unlock unprecedented efficiency.
These are not distant concepts; they are the roadmap for the immediate future, signaling a major shift toward insurance models that are hyper-personalized, automated, and predictive. Soon, this will not be a competitive advantage—it will be the industry standard.
AI and Machine Learning Will Drive Predictive Underwriting
Artificial intelligence (AI) and machine learning (ML) are moving from the periphery to the core of modern underwriting. While traditional BI analyzes historical data, AI-powered models can process massive, unstructured datasets—from satellite imagery to social media sentiment—to produce highly accurate risk forecasts. For underwriters, this enables a shift from static, one-size-fits-all pricing to dynamic risk evaluation that adjusts in real time.
This evolution is creating new opportunities and new risks. Industry forecasts predict that premiums from AI-related liability insurance alone could reach approximately $4.7 billion annually worldwide by 2032, growing at a compound rate of about 80%. This highlights the urgency for insurers to master AI, not only to write better policies but also to manage the risks inherent in the technology itself. You can discover more insights about these financial forecasts on Deloitte.com.
The Rise of Embedded and Real-Time Insurance
Another significant trend is embedded insurance, where coverage is integrated directly into another company's product or service. This model, powered by real-time data from external platforms and IoT devices, makes on-demand, usage-based insurance practical.
Consider a commercial trucking fleet whose insurance premium adjusts automatically based on live telematics data—tracking driver behavior, speed, and vehicle location, especially during a severe weather event. This requires a BI infrastructure capable of processing high-velocity data streams, a necessity for any company serious about risk mitigation. Understanding how to prepare for such events is critical, a topic we cover in our guide on disaster preparedness for businesses.
The future of insurance BI is not about more attractive dashboards. It is about making insurance autonomous and context-aware. Intelligence will be woven directly into workflows and customer interactions, making coverage seamless and perfectly matched to real-time risk.
Generative AI for Smarter Reporting and Communication
Finally, generative AI is poised to revolutionize how insurance professionals interact with their data. Instead of spending hours building complex reports, an underwriter will soon be able to ask a question in plain English, such as, "Show me all commercial properties in my portfolio with a high flood risk that lack business interruption coverage." In seconds, they will receive a complete analysis with charts and maps.
This capability will dramatically accelerate decision-making, freeing experts to focus on strategy rather than data manipulation. For brokers, it promises to automate the creation of personalized client reports and renewal proposals, injecting data-driven insights directly into every client conversation.
Answering Your Top Questions About Insurance BI
Even with a clear strategy, adopting new technology raises practical questions. Underwriters, brokers, and risk managers need to understand the real-world implications of implementing business intelligence for insurance. Let's address some of the most common questions directly.
The goal is to provide straightforward answers and position BI as a powerful business tool, not another complex IT project.
What's the First Step to Introducing BI in Our Insurance Agency?
The most critical first step is not about technology; it is about defining a business objective.
Start by identifying the single most important problem you need to solve. Are you trying to improve underwriting profitability? Reduce claims leakage? Or enhance client retention?
Once you have a clear goal, you can determine the key performance indicators (KPIs) required to track progress. This approach ensures your BI project is designed to deliver measurable business value from day one, rather than becoming an unfocused technology initiative.
How Does BI Differ from the Standard Reporting We Already Do?
This is a key distinction. Standard reporting tells you *what* happened. Business intelligence explains *why* it happened and provides indicators of what may happen next.
A standard report might show that claim costs increased by 10% last quarter. A BI system allows you to drill into that number to discover the increase was driven entirely by a specific type of water damage claim in one city following a major storm.
Business intelligence is interactive. It allows you to ask follow-up questions and use predictive analytics to get ahead of trends. Standard reporting is static and historical; BI is dynamic and forward-looking.
It is the difference between looking in a rearview mirror and using a GPS that shows the road ahead. BI transforms your data from a static record into an active tool for making smarter, real-time decisions.
Do We Need a Team of Data Scientists to Use Business Intelligence Tools?
No. Modern BI platforms are designed for business users, not just technology experts. They feature intuitive dashboards, drag-and-drop report builders, and natural language query capabilities.
While a data scientist is invaluable for developing sophisticated predictive models, the primary users of BI tools should be your underwriters, brokers, and risk managers—the individuals making daily operational and strategic decisions.
The goal is to empower your team with self-service analytics. This enables them to explore data and find answers independently, without submitting a request to the IT department for every query. Success hinges on selecting the right tools and providing targeted training to foster a culture comfortable with data-driven decision-making.
---
Turn climate-driven risk into real-time opportunity with Insurtech.bpcorp.eu. Our Sentinel Shield platform delivers validated, high-intent corporate leads directly impacted by severe weather events, empowering you to connect with businesses at their moment of greatest need. Discover how to access exclusive, pay-per-opportunity intelligence at https://insurtech.bpcorp.eu.